https://youtu.be/_41Mgmbs8Vk
How to achieve the Timely BUY POINTS?
Use penetration strategy and follow the banker fund index plus momentum and accumulation index, you can make big money in the stock market.
“Unlocking Wealth: Master the Malaysian Stock Market! Latest Trends, Hot Stocks, and Investment Strategies for Beginners and Beyond”
YBS (0025) closed at 0.33 on July 1, 2021.
Japanese candlestick chart shows a white candle, signaling a buy.
Momentum indicator rises, the banker fund is over 10%, reinforced that this is a buy signal.

The following day, i.e. on July 2, members bought 10,000 shares at the opening price of 0.33.
T+6, that is, on July 12, YBS opened at 0.385, then soared to a high of 0.555, and then gradually retreated. Members saw that the stock had retraced six bids to 0.53 so decided to sell it at the mentioned price for a profit of 1928.06. The ROI is 57.82%.

On July 30, the stock hit a low of 0.405 and closed at 0.415.
The Momentum indicator curve has gone to a low point, and the Banker Fund has also fallen to a low level. This is a sign that you should try to enter.

July 30 is Friday. Members have to wait for 2 days, Saturday (July 31) and Sunday (August 1st) before buying 10,000 shares at the opening price of 0.415 on the morning of Monday, August 2.
T+3, that is, on August 5, YBS opened at 0.46, after that rises to the high of 0.49, and six bids from the day high is 0.465.

Since the low point of the day was 0.45, I advised members to close their position at 0.48 before 4:45pm.
This trade, the net profit is 577.95, and the ROI is 13.81%.
The next day, the stock price fell and the Banker Fund retreated.
On August 2, we saw Banker Funds began to flow in, and the stock closed at 0.48.
The Momentum indicator is curved up, and the stock price has rebounded from the bottom. These 3 points alone can be used as a buy signal.
Therefore, my member bought 10,000 shares at the opening price of 0.48 on August 3.
T+4, on August 9, the stock opened at 0.525, the highest rose to 0.575, and 6 bids from the top was 0.55, but the stock finished at 0.565.
I noticed that the Momentum index had deviated, meaning that the stock price had increased but the momentum index had decreased, and the trading volume had increased dramatically. As a result, I asked the member to sell at 0.565 before 4:45pm.
This time this transaction can make a net profit of 776.50, ROI of 16.06%.
It's easy to understand how we play. We'll have to leave the market on August 11 if we don't exit on August 9.
August 11 is a Monday. The market began at 0.555, rose to 0.57, and then began to fall. It is 0.545 if you count six bids from day high. That is, if you do not exit at 0.545 before the market ends, you can exit the market at 0.50.
Traders must have the ability to make decisions. They will not make money if they hesitate too much. The stock eventually tumbled.
The Momentum indicator showed that momentum fell to its lowest point on August 24, and the stock price hung at 0.41.
However, the stock price has not yet reached its lower point. The stock price fell to 0.39 on August 27 before it stopped and closed at 0.395 on the same day.
On September 6, 10% Banker Fund appeared. The stock closed at 0.435 on that day.
On September 7, the stock closed at 0.42, the Banker Fund faded, but the hot money remained at 70%, and 30% fund belonged to retail investors.
Since the banker has entered the market on September 6, it means that this stock has attracted the attention of the major players. If we follow the market, we can sell at 0.50 or even 0.57, depending on the situation at that time.

How to Follow the Big Boys?
On July 12, 2021, I noticed banker fund has emerged about 10%, and Momentum indicator curved up.

In this case, we interpret it as a buy signal, which means we must enter the market on the next day at the opening price.

We bought 10,000 shares on July 13 at the opening price of 0.365.
And then, we sat and waited for the durian to fall.

On T + 6, i.e. on July 22, the stock opened at 0.505 and the price surged to 0.70, and then progressively dropped.
One of My EXIT STRATEGIES is that if a stock drops 6 bids from its day high, i.e. to 0.675, it's time to exit. Following my Exit Strategy, my member exit the market, and the stock closed at 0.55.

On Aug 2, according to the Banker Indicator, we can see the big boys began to make a come back, and the stock closed at 0.48.
The momentum indicator has curved up, and the stock price has risen from its low point. These three factors can be considered as a clear BUY signal.

Hence, my member bought 10,000 shares at the opening price of 0.48 on August 3,2021.

On T+4, i.e. on August 9, the stock opened at 0.525 and rises to the high of 0.575, if it retraced 6 bids will be 0.55, but the stock closed at 0.565.
I observed that the momentum index had deviated, meaning that the stock price rises but the momentum index curve is on a down trend, and the trading volume is dramatically high on that day. As a result, I asked my member to sell at a price of 0.565 before 4:45pm.
The member could made a net profit of 776.50 from this trade, with ROI of 16.06%.
My Exit Strategy is not ambiguous, we follow a set rules and that's how we trade. We must exit on August 9, if not by Aug 11 we have to get out by hook or by crook.
August 11 is a Monday, the market opened at 0.555, the price rises to 0.57 day high, and then it fell. If you count 6 bids from the top, it is at 0.545. That is to say, if you did not exit at 0.545, you should exit at 0.50 before the market closed.
Traders must be fast in making their decisions. They will not make money if they think too much. Later, we notice this stock just plummeted as we had surmised.
On August 24, the momentum index curve drop to its lowest point, but stock price is still not at its low. It is lingered at 0.41.
There is a deviation here. On August 27, the stock price only dropped to the low of 0.39 but managed to closed at 0.395.

On September 6, banker emerged about 10% of the fund on that day belonged to the banker. The stock closed at 0.435.

On September 7, the stock closed at 0.42, the Banker Fund had faded, but the hot money remained at 70% and the remaining 30% fund belonged to the retail investors.
The fact that the Banker Fund emerged on September 6 indicated that this stock has attracted the big boys to come in. If we follow buy, we probably could exit at least at 0.50 or even at 0.57 depending on the strength of the market at that time.
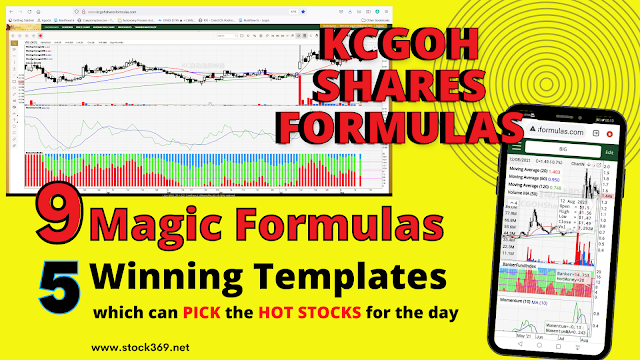
I am KC Goh. My contact number is 012-6597910. Call me if you want to learn more about my software: KCGOH Shares Formulas, with 9 Magic Formulas + 5 Strategies Templates to help you make good profit in your Stock Market Investment!
Using the Banker Fund Index in my stock trading is a good strategy.
I saw 10% of the Banker Funding flowing in on August 23rd, 2021, so I bought 10,000 shares at 0.815 the next day.


Today, on September 6th, which is the T+8 day, the share price rose to 0.96, and I got RM1,346 profit from selling the shares.
The Return On Investment (ROI) is 16.43%, and the Banker Fund has risen to 80%.

BANKER FUND INDEX INDICATORS!!!
KCGOH Shares Formulas Auto-Stock-Pick Software is now Launching
9 Magic Formulas + 5 Strategies
HELPIING YOU TO WIN IN STOCK MARKET!
💥KCGOH Shares Formulas - introducing Smart Fund Index and Rate Of Change.

| OCK | Buy | Sell | Units | Profit | % |
| 28-May | 0.42 | 50000 | |||
| 13-Jun | 0.48 | 50000 | 2741.16 | 12.98 | |
| 28-Jun | 0.445 | 50000 | |||
| 16-Jul | 0.59 | 50000 | 6951.08 | 31.06 | |
| 06-Aug | 0.50 | 50000 | |||
| 22-Aug | 0.61 | 50000 | 5180.26 | 20.6 | |
| 03-Sep | 0.57 | 50000 | |||
| 11-Sep | 0.65 | 50000 | 3648.13 | 12.73 | |
| 18520.63 | 88.19 |