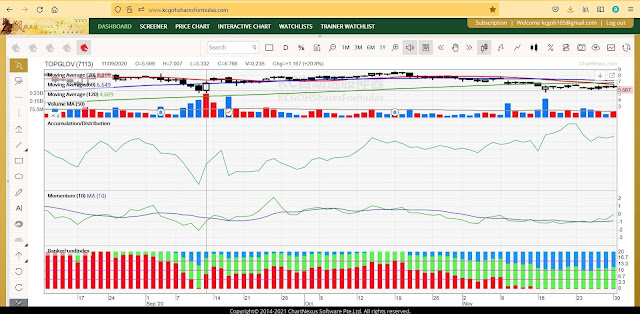


By observing the speculator’s capital chart, you can follow the speculator’s entry and exit from the stock market, which is almost a guaranteed win. Do you believe it?
We use AWC(7579) as a demonstration case:
On September 11, 2023, AWC closed at 0.46, the power index rose, and hot money returned. These two points have already constituted a real buy signal.
The next day, on September 12, 2023, members bought 21,000 shares at an opening price of 0.465.
On October 6, AWC opened at 0.575, rose to a high of 0.58, fell to a low of 0.565, and closed at 0.57.
Because this stock broke through the upper line of the Bollinger Bands and fell back, coupled with the absorption and distribution indicators, dynamic indicators, and the main outflow, these factors constituted an obvious sell signal. The 21,000 shares in hand can net a profit of 2079.72, a return rate of 21.18% (if only 10,500 are bought, the profit is halved).
On October 24, AWC closed at 0.55, the power index rose, speculators’ funds returned, good news appeared, and the stock price rose.
Members decided to buy 18,000 AWC at 0.555 when the market opened on October 25.
On November 16, this stock opened at 0.645, with a high of 0.665, a low of 0.635, and a close of 0.635.
The candle of the Japanese Yin-Yang line chart touched the top line of the Bollinger Bands, the absorption and distribution and Movement indicators both slid down, and the speculator’s funds (Banker Fund) flowed out.
Members sold at 0.635, which can net a profit of 1316.21, a return rate of 13.10%.
On November 29, this stock closed at 0.56.
There is no obvious buy signal yet, pay attention to it yourself, I am not convenient to publicly instruct, it will cross the red line.
To learn more about “KC Stock Picker” , “KC GOH Shares Formulas” and "KC Ai MCM Winner’s Tool (MCM=Money Making Machine)", please join the "KCGOH Winners' Circle 3" WhatsApp Group, we can continue to chat in the group.
Please provide your name, which state you are from, how long you have been investing in the stock market, and we will naturally send someone to contact you.
🙋♀️🙋♂️Click this link to join "KCGOH Winners' Circle 3" WhatsApp Group:
https://tinyurl.com/kcgohwinnerscircle3
After we understand your needs, we will approve you to join our special group, please do not disturb if you are not sincere. We welcome learners to join our group.